- U.S. single-family rent price gains again tripled from March 2021
- Miami remains the nation’s hottest rental market, with prices up almost 41% year over year
IRVINE, Calif., May 17, 2022 — CoreLogic, a leading global property information, analytics and data-enabled solutions provider, today released its latest Single-Family Rent Index (SFRI), which analyzes single-family rent price changes nationally and across major metropolitan areas.
U.S. single-family rent price growth continued at a record pace in March, up 13.6% from one year earlier. Slim inventory continues to squeeze renters, as do robust home price gains – both familiar culprits in declining affordability. As in months past, warmer areas of the country continued to experience the highest rental cost growth, with prices in two large Florida metro areas accelerating at about two-to-three times the national rate.
The year-over-year U.S. rent price growth once again more than tripled the gain recorded in March 2021 and more than quadrupled the increase from March 2020. Rent price appreciation slowed in early 2020 due to the uncertainty surrounding the coronavirus (COVID-19) pandemic but rebounded by autumn of that year to surpass its pre-pandemic rate.
“A shortage of single-family properties available for rent has plagued the market, pushing rents up at record-level rates,” said Molly Boesel, principal economist at CoreLogic. “The number of single-family rental properties listed in early 2022 was well below pre-pandemic levels and still shrinking from one year ago.”
To gain a detailed view of single-family rental prices, CoreLogic examines four tiers of rental prices. National single-family rent growth across the four tiers, and the year-over-year changes, were as follows:
- Lower-priced (75% or less than the regional median): 12.4%, up from 3.3% in March 2021
- Lower-middle priced (75% to 100% of the regional median): 14.1%, up from 3.5% in March 2021
- Higher-middle priced (100% to 125% of the regional median): 14.6%, up from 3.8% in March 2021
- Higher-priced (125% or more than the regional median): 13%, up from 5.3% in March 2021
Among the 20 metro areas shown in Table 1, Miami yet again posted the highest year-over-year increase in single-family rents in March 2022 at 40.7%, more than 10 times its March 2021 annual growth rate of 3.8%. Orlando, Florida, and Phoenix recorded the second- and third-highest gains at 24.6% and 18.6%, respectively, as Americans continue to seek warmer climates. Those three metro areas have experienced the country’s largest year-over-year rent increases since December 2021. Washington (7.6%) and St. Louis (7.5%) recorded the lowest annual rent price growth in March.
Differences in rent growth by property type emerged after COVID-19 took hold, as renters sought standalone properties in lower-density areas. This trend drove an uptick in rent growth for detached rentals in 2021, while the gains for attached rentals was more moderate. However, as rental inventory remains slim, the gap between attached and detached rental growth started to close last fall. In March of 2022, attached rental property prices grew by 13.2% year over year, compared to the 13.3% increase recorded for detached homes.
The next CoreLogic Single-Family Rent Index will be released on June 21, 2022, featuring data for April 2022. For ongoing housing trends and data, visit the CoreLogic Intelligence Blog: www.corelogic.com/intelligence.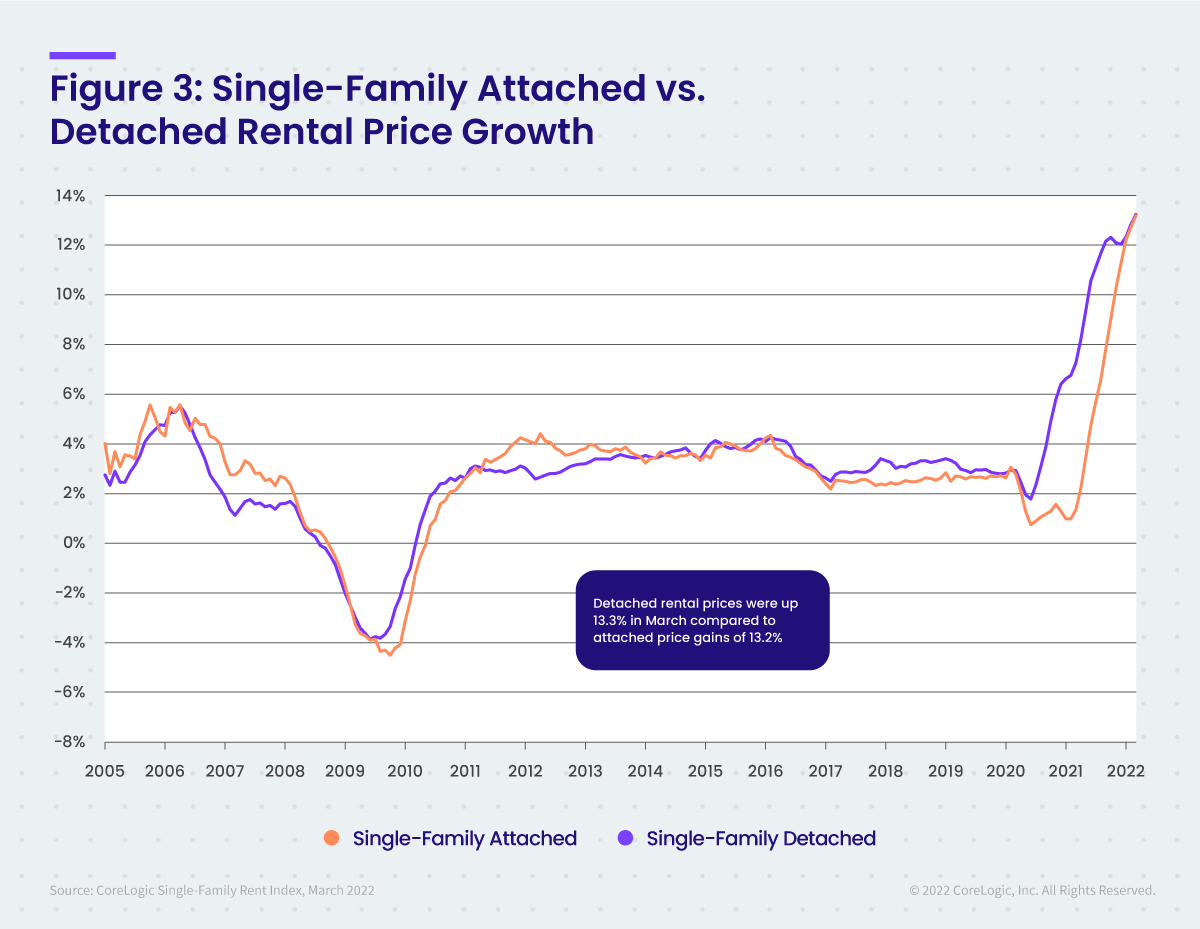
Methodology
The single-family rental market accounts for half of the rental housing stock, yet unlike the multifamily market, which has many different sources of rent data, there are minimal quality adjusted single-family rent transaction data. The CoreLogic Single-Family Rent Index (SFRI) serves to fill that void by applying a repeat pairing methodology to single-family rental listing data in the Multiple Listing Service. CoreLogic constructed the SFRI for close to 100 metropolitan areas — including 47 metros with four value tiers — and a national composite index.
The CoreLogic Single-Family Rent Index analyzes data across four price tiers: Lower-priced, which represent rentals with prices 75% or below the regional median; lower-middle, 75% to 100% of the regional median; higher-middle, 100%-125% of the regional median; and higher-priced, 125% or more above the regional median.
Median rent price data is produced monthly by CoreLogic RentalTrends. RentalTrends is built on a database of more than 11 million rental properties (over 75% of all U.S. individual owned rental properties) and covers all 50 states and 17,500 ZIP codes.


Leave A Comment